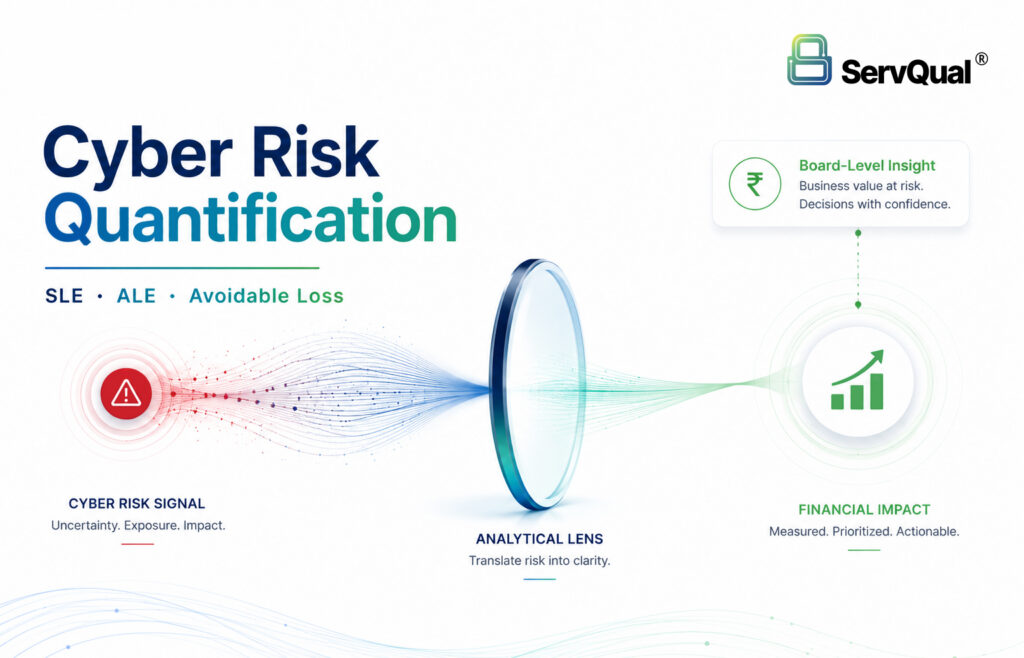
Single Loss Expectancy, or SLE, estimates the financial impact of one cybersecurity incident. It is calculated as Asset Value multiplied by Exposure Factor. Annualized Loss Expectancy, or ALE, estimates the expected annual financial loss from that risk scenario. It is calculated as SLE multiplied by Annualized Rate of Occurrence.
Avoidable Loss compares expected annual loss before and after controls are applied. It helps organizations estimate how much financial exposure can be reduced through security investment, remediation or risk treatment.
Executive Summary
Cybersecurity leaders are often asked to explain technical risk in financial terms. Qualitative scores such as high, medium and low are useful, but they do not always help boards, audit committees or finance teams understand business exposure.
Single Loss Expectancy and Annualized Loss Expectancy provide a structured way to estimate cyber risk in financial terms. SLE estimates the loss from one incident, while ALE estimates expected annual loss based on incident frequency.
Together, SLE and ALE help organizations prioritize remediation, justify security investments, evaluate control effectiveness, support cyber insurance conversations and improve risk reporting.
The goal is not to create a perfect prediction. The goal is to create a defensible, transparent and repeatable model for comparing risk scenarios and understanding avoidable loss.
Why Cyber Risk Needs Financial Quantification
Security teams generate extensive data from vulnerability scans, threat intelligence feeds, penetration tests and control assessments. However, translating this technical information into business-relevant financial metrics remains a persistent challenge.
Many organizations rely on qualitative risk ratings such as Critical, High, Medium or Low. These ratings are useful for prioritization, but they do not answer the questions that boards and executives ask:
- “What is the financial exposure from a ransomware attack on our critical systems?”
- “How much should we invest to reduce supply chain risk?”
- “What is the return on investment for our security controls?”
Without financial quantification, security spending competes poorly against revenue-generating initiatives. Cyber insurance underwriters increasingly demand quantitative risk data. Regulators expect documented risk assessment methodologies. Boards require financial risk reporting to fulfill fiduciary obligations.
SLE and ALE provide a practical framework to address these demands by translating technical risk scenarios into financial terms that support business decisions.
What Is Single Loss Expectancy?
Single Loss Expectancy (SLE) is the estimated monetary loss from a single occurrence of a specific threat scenario.
The formula is:
text
SLE = Asset Value × Exposure Factor
Asset Value represents the financial worth of the asset or business process being assessed. This can include replacement cost, revenue impact, data value, regulatory exposure or business process contribution.
Exposure Factor represents the percentage of asset value expected to be lost if the incident occurs. This considers incident severity, duration, asset criticality and the effectiveness of existing controls.
For example, if a critical application is valued at $50 million and a ransomware incident would cause 30% loss of value, the SLE would be $15 million.
What Is Annualized Loss Expectancy?
Annualized Loss Expectancy (ALE) is the expected annual financial loss from a specific threat scenario.
The formula is:
text
ALE = SLE × Annualized Rate of Occurrence
Annualized Rate of Occurrence (ARO) represents the estimated frequency of the incident in one year. For example, an ARO of 0.4 means the incident is expected once every 2.5 years.
Continuing the previous example, if the ransomware scenario has an ARO of 0.4, the ALE would be:
text
ALE = $15,000,000 × 0.4 = $6,000,000
This means the organization could expect an average annual loss of $6 million from this risk scenario, based on current controls and threat assumptions.
What Is Estimated Avoidable Loss?
Estimated Avoidable Loss is the financial exposure that can be reduced through security controls, remediation or other risk treatment measures.
The formula is:
text
Avoidable Loss = ALE Before Controls – ALE After Controls
If improved controls reduce the ALE from $6 million to $2 million, the avoidable loss is $4 million. This represents the estimated risk reduction achieved by the control investment.
This calculation helps organizations answer a critical question: “Is the cost of this security control justified by the risk reduction it provides?”
SLE, ALE and Avoidable Loss Formulas
The basic calculations are:
Single Loss Expectancy
text
SLE = Asset Value × Exposure Factor
Annualized Loss Expectancy
text
ALE = SLE × Annualized Rate of Occurrence
Estimated Avoidable Loss
text
Avoidable Loss = ALE Before Controls – ALE After Controls
Security Investment Return
text
Security ROI = (Avoidable Loss – Control Cost) / Control Cost
These calculations should be treated as decision-support estimates, not exact predictions. The quality of the output depends on asset valuation, incident assumptions, threat frequency, control effectiveness and business context.
SLE and ALE Input Table
| Input | Meaning | Example |
|---|---|---|
| Asset Value | Estimated financial value of the asset or business process | $50,000,000 |
| Exposure Factor | Percentage of value expected to be lost in one incident | 30% |
| SLE | Expected loss from one incident | $15,000,000 |
| Annualized Rate of Occurrence | Estimated yearly frequency of the event | 0.4 |
| ALE | Expected annualized loss | $6,000,000 |
| Post-Control ALE | Expected annualized loss after control improvement | $2,000,000 |
| Avoidable Loss | Estimated reduction in annualized loss | $4,000,000 |
Example: Ransomware Risk Scenario
Assume a critical business application has an estimated asset value of $50,000,000.
If a ransomware incident is expected to cause a 30% loss of value, the Single Loss Expectancy is:
text
SLE = $50,000,000 × 30% = $15,000,000
If the estimated Annualized Rate of Occurrence is 0.4, meaning one incident every 2.5 years, the Annualized Loss Expectancy is:
text
ALE = $15,000,000 × 0.4 = $6,000,000
If improved controls reduce the annualized loss from $6,000,000 to $2,000,000, then the estimated avoidable loss is:
text
Avoidable Loss = $6,000,000 – $2,000,000 = $4,000,000
If the control costs $500,000 annually, the estimated return can be calculated as:
text
Security ROI = ($4,000,000 – $500,000) / $500,000 = 700%
This does not guarantee the organization will save exactly that amount. It gives leadership a financial model for comparing control investment against risk reduction.
Example: Security Control Investment
Organizations can use SLE and ALE to evaluate competing security investments.
| Investment Option | Cost | ALE Reduction | Avoidable Loss | Security ROI |
|---|---|---|---|---|
| Network Segmentation | $2,500,000 | $6,750,000 | $4,250,000 | 170% |
| MFA Enhancement | $1,000,000 | $3,400,000 | $2,400,000 | 240% |
| SOC Upgrade | $2,000,000 | $2,500,000 | $500,000 | 25% |
| Security Awareness | $500,000 | $1,700,000 | $1,200,000 | 240% |
This analysis supports risk-based investment decisions, helping organizations allocate limited security budgets to the controls that provide the greatest financial risk reduction.
Inputs Required for SLE and ALE
Accurate SLE and ALE calculations require several inputs:
Asset Valuation includes replacement cost, revenue impact, data value, regulatory exposure, business process value and insurance valuation.
Threat Scenarios should be specific and applicable to the organization, such as ransomware, data breach, business email compromise or supply chain compromise.
Exposure Factor considers incident severity, duration, asset criticality, existing controls and data sensitivity.
Annualized Rate of Occurrence draws from historical incident data, threat intelligence feeds, industry breach statistics and expert judgment.
Control Effectiveness measures how well existing controls reduce the likelihood or impact of incidents.
Organizations should document all assumptions used in calculations to support transparency and auditability.
Common Mistakes in SLE and ALE Calculations
| Mistake | Impact | Correct Approach |
|---|---|---|
| Incomplete asset inventory | Unquantified risk exposure | Implement continuous asset discovery |
| Inaccurate asset valuation | Incorrect risk prioritization | Use multiple valuation methods |
| Ignoring indirect costs | Underestimated risk | Include reputation, churn and business interruption |
| Static ARO estimates | Outdated risk assessments | Update ARO with threat intelligence |
| Control effectiveness overestimation | Underestimated residual risk | Implement continuous control monitoring |
| Generic exposure factors | Inaccurate SLE calculations | Develop organization-specific EF methodology |
| Not validating with incidents | Inaccurate methodology | Conduct post-incident financial analysis |
| Insufficient stakeholder engagement | Inaccurate business impact | Establish cross-functional risk teams |
How SLE and ALE Support Compliance and Board Reporting
SLE and ALE methodology aligns with multiple regulatory and framework requirements:
ISO 27001: Clause 6.1.2 requires risk assessment processes. SLE-ALE provides quantitative risk methodology.
NIST CSF 2.0: ID.IM-02 requires risk identification including quantitative impact assessment.
PCI DSS: Requirement 12 requires risk analysis methodology.
GDPR: Article 32 requires security proportionate to risk, supported by SLE-ALE quantification.
SOC 2: CC3.0 requires risk assessment using quantitative methods.
For board reporting, SLE and ALE provide financial metrics that enable informed oversight. Boards can see aggregate ALE, risk concentration, risk trends, control effectiveness and investment justifications in financial terms.
SLE and ALE Checklist for Risk Teams
Organizations using SLE and ALE should validate the following:
- Maintain an accurate inventory of critical assets and business processes.
- Define asset value using revenue impact, replacement cost, data value, regulatory exposure and business process value.
- Define specific threat scenarios instead of calculating generic cyber risk.
- Estimate Exposure Factor based on incident severity, duration, asset criticality and control maturity.
- Estimate Annualized Rate of Occurrence using incident history, threat intelligence, industry data and expert judgment.
- Document all assumptions used in calculations.
- Calculate SLE and ALE before and after proposed controls.
- Use avoidable loss to support investment prioritization.
- Validate assumptions after real incidents or tabletop exercises.
- Map risk scenarios to ISO 27001, NIST CSF, SOC 2, PCI DSS, GDPR or other applicable requirements.
- Review calculations quarterly or when major assets, threats or controls change.
- Use SLE and ALE as decision support, not as guaranteed financial prediction.
How ServQual and SUSAN Help
ServQual helps organizations strengthen cybersecurity, risk management, GRC, audit readiness, cloud security, incident response and Secure by Design programs.
SUSAN, ServQual’s AI driven cybersecurity, privacy and GRC platform, can help teams connect risk visibility, asset context, control evidence, remediation ownership and audit readiness into one assurance view.
For SLE and ALE risk quantification, SUSAN can support teams by helping organize:
- Asset inventory and business context
- Risk scenarios and control gaps
- Risk scoring and remediation ownership
- Evidence for control effectiveness
- Compliance and framework mapping
- Dashboard visibility for leadership
- Continuous Monitoring & Evidence
- Continuous Assurance across cybersecurity, privacy and GRC workflows
Explore SUSAN:
https://srql.com/services/susan/
Explore SUSAN AI Risk Scoring:
https://srql.com/services/susan-ai-risk-scoring/
Explore SUSAN Unified GRC Dashboard:
https://srql.com/services/susan-unified-grc-dashboard/
Explore Governance, Risk, Compliance & Audits:
https://srql.com/services/governance-risk-compliance-audits/
Explore Cybersecurity Services:
https://srql.com/services/cyber-security-solutions/
"SLE and ALE do not predict the future. They make cyber risk financially comparable."

Harshal Patil
Director of Accounts | ServQual
FAQ
Most frequent questions and answers
Single Loss Expectancy is the estimated financial loss from one cybersecurity incident. It is calculated as Asset Value multiplied by Exposure Factor.
Annualized Loss Expectancy is the expected annual financial loss from a risk scenario. It is calculated as SLE multiplied by Annualized Rate of Occurrence.
Exposure Factor is the percentage of asset value expected to be lost if a specific incident occurs.
Annualized Rate of Occurrence is the estimated frequency of a risk event in one year. For example, 0.5 means once every two years.
Estimated Avoidable Loss is the difference between ALE before controls and ALE after controls. It represents the financial exposure that may be reduced through risk treatment.
SLE and ALE help compare the cost of a security control against the expected reduction in financial exposure.
No. SLE and ALE are estimation methods. They should be based on documented assumptions, validated data and regular review.
SLE and ALE can support risk assessment and treatment activities under ISO 27001, NIST CSF, SOC 2, PCI DSS, GDPR and internal enterprise risk management programs.
SUSAN can help teams connect risk scenarios, asset context, evidence, control gaps, remediation ownership and leadership dashboards into a structured assurance workflow.
Calculations should be reviewed quarterly or whenever significant changes occur in assets, threats, controls or business operations.
Quantify Cyber Risk in Financial Terms
Cybersecurity risk decisions should not rely only on qualitative ratings. SLE, ALE and Estimated Avoidable Loss help organizations compare threat scenarios, justify security investment and explain risk exposure in business language.
ServQual helps organizations strengthen cyber risk management, GRC, audit readiness, cloud security, incident response and Secure by Design programs. Explore SUSAN or contact ServQual to connect risk scenarios, asset context, control evidence, remediation ownership, avoidable loss and Continuous Assurance into one structured governance view.
Disclaimer: This document is provided for educational and informational purposes only. Organizations should validate SLE and ALE methodology with internal experts and professional advisors. ServQual and SUSAN capabilities described are representative and actual capabilities depend on deployment scope, configuration and organizational requirements.